In the realm of academia, particularly in pursuing a PhD, the ability to harness the potential of quantitative analysis becomes even more critical. A PhD journey often involves conducting rigorous research, collecting extensive data, and deriving meaningful insights to contribute to the existing body of knowledge. In this context, quantitative analysis and tools like SPSS play a pivotal role in enabling researchers to delve deep into their data and unlock valuable insights.
This blog intends to investigate SPSS’s use in quantitative analysis, concentrating on the methods, tools, and best practices that increase its efficiency. The extensive set of statistical analysis tools offered by IBM’s SPSS to researchers makes it easier to manipulate, visualise, and understand data. Because of its adaptability and user-friendly interface, professionals from a variety of professions frequently use it.
Quantitative research relies heavily on SPSS (Statistical Package for the Social Sciences), which provides a wide range of tools, methods, and best practices. There are several reasons why SPSS is valuable and important for research. First of all, SPSS offers users of all levels of programming experience a user-friendly interface that makes data administration, analysis, and visualisation easier. The second advantage of SPSS is that it provides a broad range of statistical techniques that enable researchers to conduct a variety of analyses, including descriptive statistics, inferential tests, regression analysis, factor analysis, cluster analysis, and survival analysis.
Examples
SPSS (Statistical Package for the Social Sciences) is frequently used in the social sciences and other disciplines for statistical analysis. For quantitative analysis, it offers a wide range of features and capabilities. Here are a few instances of how SPSS has been used in quantitative analysis:
Descriptive Statistics: Using SPSS, researchers can compute and examine a variety of descriptive statistics, including frequencies, variable distributions, and measures of central tendency (mean, median, and mode).
Correlation Analysis: Using SPSS, researchers can use correlation analysis to look at the connections between different variables. It determines the degree and direction of the correlations between variables by calculating correlation coefficients (such as Pearson correlation).
Regression Analysis: Regression analysis is a method that helps researchers comprehend the connection between a dependent variable and one or more independent variables. Regression analysis tools are available in SPSS. Regression models of various kinds, including multiple regression, logistic regression, and hierarchical regression, are supported.
Prior research
“Multivariate Data Analysis” by Hair Jr, Black, Babin, and Anderson: This thorough textbook offers a thorough review of SPSS-based multivariate data analysis methods. Factor analysis, cluster analysis, discriminant analysis, logistic regression, and structural equation modelling are just a few of the many techniques it covers. The book is an invaluable tool for researchers and students in the social sciences since it provides detailed instructions, examples, and interpretation of findings.
“Discovering Statistics using IBM SPSS Statistics” by Andy Field: This book covers statistical ideas and their use with SPSS in an entertaining and approachable manner. It covers a wide range of statistical methods, including advanced multivariate analysis as well as simple descriptive statistics. For better comprehension, the book offers practical examples, humour, and interactive elements. Additionally, it offers instructions on how to prepare data, explore data, and analyse SPSS results.
“Straightforward Statistics for the Behavioral Sciences” by Jonah Evans: Using SPSS as the analysis tool, this book focuses on statistical ideas and how they are applied in the behavioural sciences. It offers a concise and understandable introduction to statistical analysis, covering subjects including regression analysis, ANOVA, t-tests, correlation analysis, and hypothesis testing. Examples and exercises are included throughout the book to help readers learn and apply what they have learned.
These publications include a combination of theoretical justifications, real-world illustrations, and tips for using SPSS for quantitative analysis. They can be helpful tools for researchers, students, and practitioners in a variety of subjects and cater to different skill levels, from beginner to advanced.
Tools
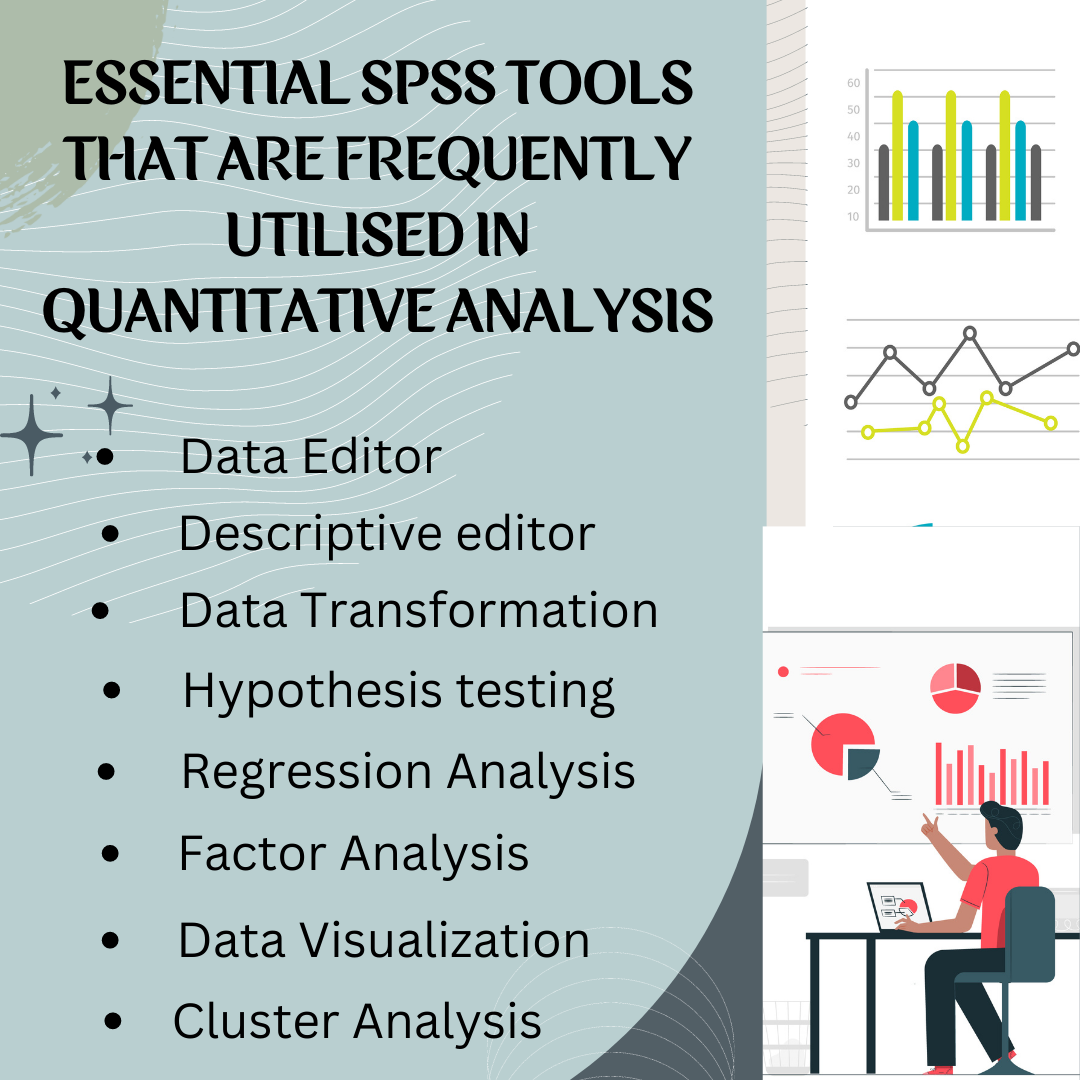
For quantitative analysis, SPSS (Statistical Package for the Social Sciences) offers a variety of tools and functions. Here are some essential SPSS tools that are frequently utilised in quantitative analysis:
Data Editor: SPSS comes with a data editor that functions like a spreadsheet and allows users to enter, modify, and manage data. Users can execute data transformations, import data from different file formats, and input data directly.
Descriptive editor: For variables like measures of central tendency (mean, median, and mode), measures of dispersion (standard deviation, range), frequencies, and distributions, SPSS offers tools to generate and analyse descriptive statistics. In SPSS, the Descriptives and Explore methods are frequently used for this.
Data Transformation: SPSS offers a range of data transformation options, allowing users to recode variables, compute new variables based on mathematical or logical expressions, and create categorical variables from continuous variables. The Transform menu in SPSS provides various functions for data manipulation.
Hypothesis testing: An array of hypothesis tests, including t-tests, ANOVA, chi-square tests, and nonparametric testing, can be carried out using SPSS. In SPSS, the Analyse menu offers specific procedures for various test types, allowing users to look at correlations, group differences, and associations between variables.
Regression Analysis: The statistical package SPSS provides a number of regression techniques, including logistic regression, multiple regression, and hierarchical regression. With the use of these tools, users can investigate the connections between variables, make predictions about the results, and evaluate the importance and contribution of independent variables.
Factor Analysis: SPSS provides tools for exploratory and confirmatory factor analysis. These procedures help users identify underlying factors or dimensions within a set of variables, assess the factor structure, and interpret the results. The Factor Analysis and Structural Equation Modeling (SEM) modules in SPSS cater to this analysis.
Data Visualization: SPSS offers various options for data visualization. The Chart Builder tool allows users to create a wide range of charts, graphs, and plots to visually represent quantitative data. Users can customize the appearance and format of visualizations, and the resulting charts can be exported for further use.
Cluster Analysis: SPSS includes cluster analysis procedures to identify natural groupings or clusters within a dataset. It helps users classify cases based on similarities or dissimilarities between variables. The Cluster Analysis tool allows for different clustering algorithms and provides options to interpret and validate the results.
Techniques
SPSS (Statistical Package for the Social Sciences) offers a wide array of techniques for quantitative analysis. Here are some commonly used techniques within SPSS:
Factor Analysis: SPSS provides tools for exploratory and confirmatory factor analysis. Exploratory factor analysis helps identify underlying factors or dimensions within a set of variables, while confirmatory factor analysis tests a pre-defined factor structure. These techniques assist in understanding the latent structure and interrelationships among variables.
Cluster Analysis: SPSS offers cluster analysis techniques to identify groups or clusters within a dataset based on similarities or dissimilarities between cases. Cluster analysis helps users segment data into meaningful groups and uncover patterns or subgroups within a population.
Survival Analysis: SPSS includes survival analysis techniques for analyzing time-to-event data, such as survival times or failure times. These techniques are commonly used in medical research and other fields where the duration until an event occurs is of interest. SPSS provides tools for estimating survival functions, conducting log-rank tests, and building survival models.
Structural Equation Modeling (SEM): SPSS offers SEM capabilities for testing complex relationships and models involving latent variables. Users can specify and estimate structural models, assess model fit, and examine direct and indirect effects among variables.
Data Mining: SPSS provides data mining techniques, including decision trees, neural networks, and clustering algorithms, through its Modeler module. These techniques help users uncover patterns, make predictions, and generate insights from complex and large datasets.
Best practices
When conducting quantitative analysis using SPSS (Statistical Package for the Social Sciences), it is important to follow best practices to ensure accurate and reliable results. Here are some best practices to consider:
Data Cleaning and Preparation: Before analyzing data in SPSS, it is crucial to perform thorough data cleaning and preparation. This involves checking for missing values, outliers, and data entry errors. Imputing missing data, handling outliers appropriately, and ensuring consistent variable formats contribute to the quality of the analysis.
Variable Coding and Labeling: Assigning appropriate codes and labels to variables in SPSS enhances data interpretation. Ensure that variables are properly coded, and labels are clear and meaningful. For categorical variables, assign value labels to improve the readability of the output.
Data Entry and Data Management: When entering data directly into SPSS, use the Data Editor interface efficiently. Utilize the various tools available for data management tasks, such as sorting cases, creating new variables, and recoding variables. Keep a well-organized and annotated syntax or script file to document data manipulation steps.
Documentation: Documenting your analysis process is essential for reproducibility and transparency. Maintain clear and detailed notes about the procedures performed, variable definitions, and any changes made to the dataset. Documenting your analysis steps will help ensure accuracy and facilitate future replication or extension of the study.
Choosing the Appropriate Analysis Approaches: Based on your research objectives and the characteristics of your data, select the statistical approaches that are most appropriate. The best appropriate technique must match your study design and objectives because SPSS provides a broad variety of analytic techniques.
Interpreting and Reporting Results: Take the time to thoroughly understand and interpret the results obtained from your analysis. Pay attention to effect sizes, statistical significance, and confidence intervals. Provide clear explanations and context for the findings in your reporting, using appropriate tables, figures, and text.
Validating Results: Validate your results by conducting sensitivity analyses or cross-checking with alternative statistical techniques. This helps ensure the robustness of your findings and minimizes potential biases or errors.
Continuous Learning: Stay updated with the latest features and enhancements in SPSS. Attend training sessions, workshops, or online tutorials to enhance your knowledge and skills in using SPSS for quantitative analysis. Engage with the SPSS user community to learn from others and seek guidance if needed.
In conclusion, exploring the application of SPSS in quantitative analysis reveals its significance and versatility as a powerful tool for researchers. Through its robust set of tools, SPSS enables researchers to manage, analyze, and visualize data efficiently. The availability of various techniques, ranging from descriptive statistics to advanced modelling, empowers researchers to explore complex relationships, make accurate predictions, and uncover hidden patterns within their data. Adhering to best practices, such as data cleaning, proper variable coding, and thorough documentation, ensures the integrity and reproducibility of research findings. Moreover, the user-friendly interface and extensive learning resources make SPSS accessible to researchers at all skill levels. By leveraging SPSS in quantitative analysis, researchers can extract valuable insights, contribute to scientific knowledge, and drive evidence-based decision-making across diverse fields. Overall, the comprehensive tools, techniques, and best practices offered by SPSS make it an invaluable asset in quantitative research.
Now, if you want to learn SPSS from the Best SPSS Training Institute, then you can visit our website https://elkindia.com/spss-trainings.php to learn more about us.